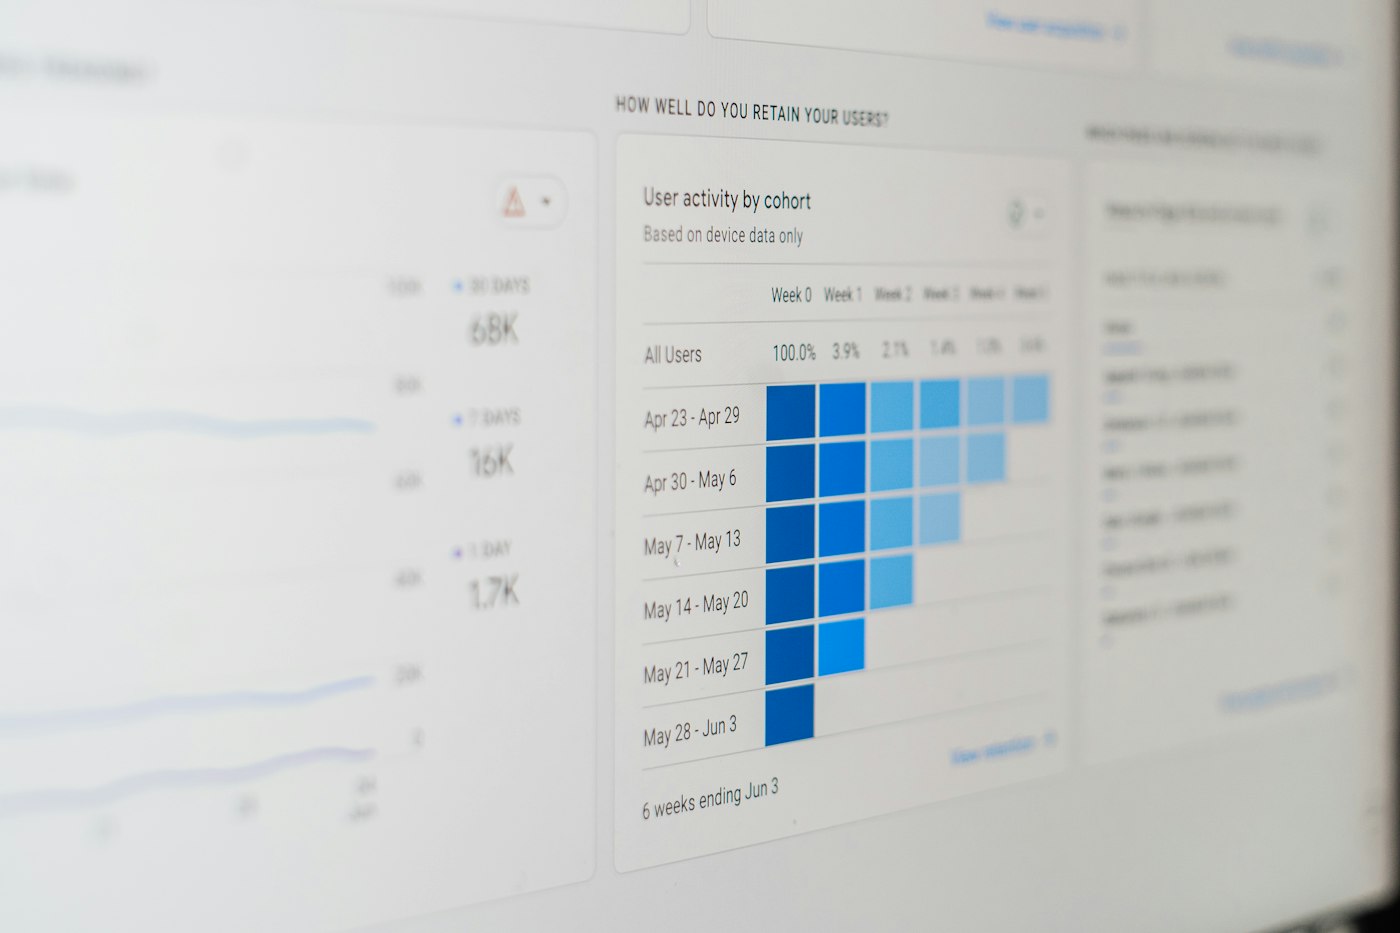
It is a conversation we have had more than once. The business invested in a proper BI platform. There were licences, a data specialist, a few months of work. Then the launch: everyone gathered round the screen, and there was one dashboard. Sales by month, by region, with a filter. The owner's reaction, very reasonably: "That's it? I could get that from the accounting package."
One report after months of work feels like failure. Usually it is not. It is what the foundations of BI look like from the outside. But it is also a warning sign, because a BI tool only grows in the direction the business points it, and the specialists cannot point it for you.
Why the first report takes so long
Almost none of the early work is visible in the report. Before that one dashboard could exist, someone had to:
- Connect the sources. The accounting package, the POS, the CRM, the spreadsheet that holds the targets. Each has its own quirks, access rules and refresh limits.
- Clean the data. The same customer spelt three ways, regions that changed names in 2023, credit notes that are negative in one system and positive in another. Clean data is unglamorous and it is most of the job.
- Model it. Arrange the data so that sales, customers, products and dates relate correctly, which is what lets the next report take days instead of months.
- Agree definitions. Is a sale counted on order, on invoice or on payment? Does revenue include VAT? Are returns netted off? Each department had its own answer, and the dashboard has to pick one.
That foundation is the real asset. The first report is just the proof that it works. A well-built model makes the second report quick, and the tenth almost trivial.
Why it then stays at one report
This is the part that is genuinely a problem, and it is rarely the specialists' fault. The BI team built the obvious first report, the one everybody asked for during scoping, and then waited for direction. The direction did not come. Managers were busy, the dashboard was "nice", and nobody sat down to say what they actually needed to see next.
BI specialists are very good at answering questions. They are not in a position to decide which questions matter to your business this quarter. They do not know that the margin on one product line has been worrying you, that a big customer has started paying late, or that you are deciding whether to open a second branch. Without that, they build what is technically interesting or what the loudest person asked for.
A BI tool does not know what you are worried about. It can only show you what someone asked it to show.
How BI actually grows
BI rarely arrives fully formed. In the businesses where it works, it grows in stages, and each stage is pulled by the business:
- Visibility. What happened? Sales, costs, stock, debtors, in one place, refreshed automatically instead of compiled by hand. Most of the value of the first few months is time saved and arguments ended.
- Diagnosis. Why did it happen? Drilling from a regional dip to the branch, the product, the customer. This needs the business to say which "why" questions come up in management meetings.
- Monitoring. Tell me when something changes. Alerts on overdue debtors past a threshold, stock below cover, margin outside a range. This needs the business to define what "normal" is.
- Forward-looking. What is likely to happen? Forecasts and trends. Only worth doing once the first three are trusted.
Each stage depends on decisions only the business can make. Skipping straight to stage four, which is often what the sales pitch promised, rarely works when stage one is still being questioned.
The ten-question exercise
Take an hour and write down the ten questions you ask most often about your business: in meetings, on Monday mornings, when the bank calls. "Which customers are buying less than last year?" "What is our real margin per job after rework?" "How many days of stock do we hold on our top twenty lines?" Rank them, and hand the list to your BI team. That list is the most valuable document a BI project can have, and in our experience almost nobody writes it.
What the owner needs to bring
You do not need to learn the tool. You do need to provide the things only you can provide:
- The decisions. Not "I want a dashboard" but "I need to decide each month which customers to put on hold, so show me who is drifting". A report built for a decision gets used.
- The definitions. When finance and sales disagree on what counts as revenue, someone with authority has to settle it. Once.
- The few measures that matter. Our guide to KPIs that matter argues for a handful, not fifty. A dashboard with forty tiles is one nobody reads.
- The time. A thirty-minute review every two weeks with the BI team: what got used, what did not, what is next. That rhythm is what turns one report into a working system.
Then use what is built. The fastest way to kill a BI programme is to keep asking for the monthly spreadsheet "just this once". If the dashboard is wrong, say so and get it fixed; if it is right, make it the version the meeting uses. Dashboards that get used are the ones the leadership opens first.
A sensible first quarter
If you are where this post started, with a live platform and one report, here is a realistic plan. In the first month, agree the definitions and the ranked question list. In the second, build the next three reports from the top of the list and retire anything nobody opened. In the third, put the dashboards into the management meeting and stop producing the old pack. Whether the tool is Power BI or something else matters much less than this rhythm.
The single report is not the problem. A single report that is still the only one in six months' time is, and the fix for that sits with the business, not with the tool.